Saturday, 27 June 2020

Karyotype methods and applications


A karyotype describes all the chromosomes of a cell, usually visualised as a systemised arrangement of chromosome pairs, in descending order of size.
It is used to analyze the number and structure of all the chromosomes and provides a low-resolution genome-wide screen for chromosomal abnormalities.
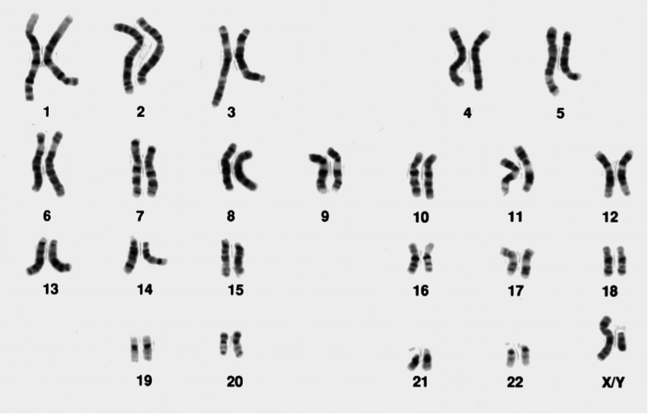
An image of a normal male karyotype with 23 pairs of chromosomes
Figure 1: A normal male karyotype (note the X and Y sex chromosomes)
Original image from the National Institutes of Health and used under a public domain license.
When clinical cytogenetic analysis started in the 1960s, solid staining was used, which meant that the different chromosomes were only recognizable by size and shape.
In the 1970s the visualisation of chromosomes improved due to the development of specific stains and enzyme digestion techniques, giving the chromosomes reproducible banding patterns. Different techniques were utilised by different countries.
For instance, France used Q-banding whereas the UK used a combination of enzyme digestion with trypsin and G-banding (see below). Using these techniques, each chromosome pair could be visualised with a unique pattern, resembling a bar code.
This not only helped cytogeneticists to recognise the different chromosomes, but also allowed them to see when parts of the chromosome were rearranged, deleted or duplicated. The most widely used stain is the Giemsa stain, giving the familiar G-banding appearance shown in Figure 1.

How is a karyotype done?

Karyotyping can be done from any sample from which you can obtain nucleated cells which retain the potential to divide, most commonly:
  • Blood
  • Bone marrow
  • Skin
  • Prenatal samples (such as CVS or amniotic fluid)
Cells are cultured in an environment which includes stimulants for cell division, then arrested at metaphase and harvested for analysis. Cell culture can take anything from 3 days (blood/bone marrow) to 7-14 days (skin, prenatal samples).
This requirement to culture the cells increases the turnaround time, but is unavoidable.
Once harvested, the cells are mounted on slides, banded (enzyme treated and stained), then viewed under a light microscope (x1000).

How is a karyotype analysed?

The cytogeneticist counts the chromosomes, pairs the homologues and compares the banding pattern in each set of homologues to identify any differences. They are aided by software which allows them to ‘cut and paste’ the chromosomes so that they can be aligned for comparison, as shown in Figure 1.
Many attempts have been made to develop computer software to replace the job of the trained cytogeneticist but it has not been possible to replace the pattern-recognition skills of the human eye.
Even in the best hands however, the limit of resolution of a karyotype is around 5 Mb, and in many applications karyotyping has been superseded by the use of higher-resolution techniques such as array-CGH.

What sorts of abnormalities can a karyotype identify?

Karyotyping is able to identify numerical abnormalities in the chromosomes (also known as aneuploidy), where a chromosome is missing or present in one or more extra copies. Examples of this include trisomy of chromosomes 13, 18 or 21, or sex chromosome abnormalities such as Turner syndrome (45,X) or Klinefelter syndrome (47,XXY).
Karyotyping can also identify structural abnormalities in the chromosomes including rearrangements (such as translocations, insertions or inversions), deletions and duplications.
Chromosome deletions can be detected on karyotype down to a resolution of around 5 Mb, but some are very subtle and require a trained eye.
The karyotype shown in Figure 2 shows a 22q11.2 deletion associated with velocardiofacial (or DiGeorge) syndrome. Would you have spotted it?
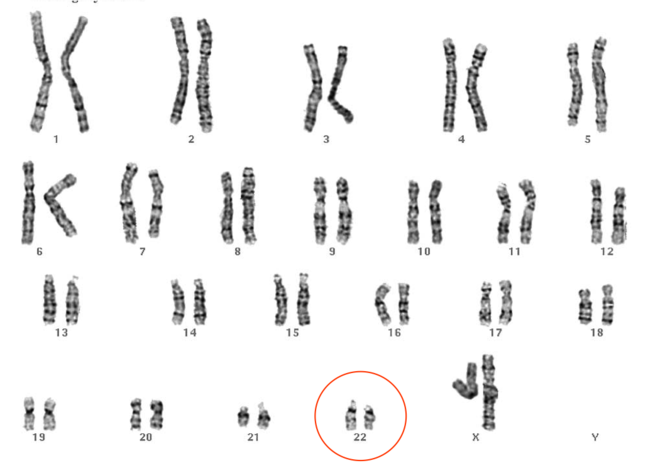
Image of a Karyotype showing 22q11.2 deletion
Figure 2: Karyotype showing 22q11.2 deletion
© St George’s, University of London

How are karyotypes reported?

A clinical karyotype report will include a description of the cytogenetic findings, described using standardized nomenclature and displayed using a cartoon representation of the chromosome and its banding pattern, called an ideogram (Figure 3).
Image of an ideogram representation of chromosome 13
Figure 3: Ideogram representation of chromosome 13 Original image from Human chromosome ideograms from NCBI’s Genome Decoration Page 
There may also be a description of any additional tests undertaken to confirm the results, a literature review with any suspected associations with phenotype, a description of any follow-up studies required and, where appropriate, recurrence risks will be given.

What is karyotyping used for currently?

In many contexts karyotyping has been superseded by the use of array CGH, which can also pick up numerical and structural abnormalities in the chromosomes, and at much higher resolution, however karyotyping is still in use in certain clinical situations.
One such situation is in the investigation of infertility or recurrent miscarriage, where a balanced rearrangement is suspected. A balanced translocation describes a rearrangement of chromosomal material, but with no overall gain or loss of genetic material.
The balanced translocation carrier is usually unaffected themselves, however problems may arise when they try to have children as the balanced translocation can affect the way that the chromosomes divide during meiosis, and imbalance can then occur in the offspring.
In this context, karyotyping has a distinct advantage over array CGH in that it is able to detect balanced rearrangements, which array CGH is not.
This is because a karyotype provides a visual representation of the chromosomes, unlike array CGH, which provides quantitative information on the amount of chromosomal material present, but not its location.

Question 1

1. Which of the following samples is not suitable for karyotype analysis?
2. Which of the following statements about karyotype analysis is false?
3. Study the karyotype below. Can you spot the diagnosis?
4. Study the image below which includes a chromosome deletion associated with a recognised developmental disorder. Compare each of the chromosomes to its pair to see whether you can recognise any difference in banding pattern which might be indicative of there being a chromosome deletion or duplication. What syndrome do you think this patient has?

Answers:-
1. D
An EDTA tube cannot be used. The correct blood tube to use for karyotype analysis is lithium-heparin. Samples for array CGH are collected in an EDTA tube however.

2. B
For karyotype preparation chromosomes are arrested in metaphase.

3. D
One copy of chromosome 22 looks shorter, and one copy of chromosome 9 appears longer. This translocation gives rise to an oncogenic fusion gene bcr-abl, causing chronic myeloid leukaemia (CML).

4. D
The short arm of the left-hand chromosome 4 is shorter in the top image than in the bottom image, due to a 4p deletion. This is associated with Wolf Hirschhorn, a developmental disorder characterised by a distinctive facial appearance, a (usually) severe intellectual disability and sometimes seizures.
Source:-


Simple question and answers: Fluorescence in situ hybridisation (FISH)

1.Which of the following statements about FISH probes is false?

Fluorescent in situ hybridisation (FISH)


 Fluorescent in situ hybridisation, or FISH is a technique that uses molecular DNA probes to detect complementary sequences along a chromosome. Unlike whole genome analyses, such as karyotyping or array CGH, FISH uses DNA-specific probes and will provide information both about the copy number of a chromosome region-- so that's whether a region's deleted or duplicated-- but also about the locational position of that region.
 Let's spend a bit of time thinking about how FISH works. A FISH probe is designed which is complementary to the strand of DNA which you want to identify. The probe is labelled or tagged with a coloured fluorochrome. The chromosomes of the target cells are arrested in metaphase. 
Skip to 0 minutes and 50 seconds
The cells in the chromosomes are fixed onto the surface of a glass slide. The slide is treated so that the genomic DNA is denatured into single strands. The slide is then washed with the single strand probe DNA. And the probe anneals, or hybridises, to the single-stranded target DNA, which is still in its natural position on the chromosome. That's a really key feature of FISH. So it is looking at the target DNA in situ. And because the probe is being tagged with a fluorochrome, which is a molecule which fluoresces when it is excited by a particular wavelength of light, it can be visualised using a fluorescent microscope.
Skip to 1 minute and 26 seconds
 Indeed, several different probes can be hybridised, observed, and then compared simultaneously by using different colours and combinations of these fluorochromes for each probe.

There are four major groups of FISH probes, which anneal to different types of DNA. Alpha satellite probes are complementary to the repetitive DNA sequences found at the centromere. Although there is considerable overlap between the DNA content at the centromere, there's also usually enough differences between chromosomes that individual chromosomes can be distinguished. However, that's not true for chromosomes 13 and 21. And it's also very difficult to distinguish chromosome 14 from chromosome 22 with an alpha satellite probe.
And as is often the case, it's actually usually really important to distinguish chromosomes 13 and 21, for instance, if a trisomy is suspected prenatally. And so in this situation, it's important to use other more specific probes that are specific to that chromosome region. Beta satellite probes are designed to anneal to the non-transcribed sequences of the acrocentric chromosomes. And these are chromosomes 13, 14, 15, 21, and 22. Beta satellite probes might be used to interrogate, for instance, extra material on the short arm of an acrocentric chromosome. Unique sequence probes are designed to anneal to specific chromosome regions. And these probes identify sequences usually present in only one copy number per chromosome.
Unique sequence probes are therefore locus specific and can detect a specific chromosome region or gene. And then finally, whole chromosome paints consist of a number of probes, which cover the whole of the chromosome other than the centromere region and contain a mixture of overlapping probes. 
And this is a picture of a whole chromosome paint. And you'll see that it will paint the entire length of a chromosome, and can be used to identify the origin of unidentified material or rearranged chromosomes or marker chromosomes. 
So let's think a bit about the applications of FISH. Historically, FISH was used in a wide variety of applications, many of which are listed here on this slide. However, the technique is time-consuming, costly, and laborious.
Skip to 3 minutes and 25 seconds
In many areas, it's now been superseded by newer, faster techniques. For instance, prenatal aneuploidy screening is now commonly done using QF-PCR. And array CGH has superseded FISH as the go-to test for microdeletion and telomere screening. Nevertheless, FISH still has a role in confirming array CGH findings. And it can be used to clarify the nature of a balanced or unbalanced translocation, and has found an increasing variety of applications in hemato-oncology. 
Let's have a quick look at how FISH was used for aneuploidy screening. So I think this nicely shows the visual nature of FISH. The image here shows a slide with trisomy 21. You'll see that two chromosome-specific probes are used. The green probe anneals to unique regions of chromosome 13, whereas the red probe is specific to chromosome 21. And on this slide, you'll see that there are three red signals, whereas there are only two green signals. So the three red signals are indicative of there being trisomy 21, or Down syndrome. Common microdeletion syndromes with consistent break points usually arise due to non-homologous recombination. And there are various commercially produced probes for these different microdeletion syndromes.
So here we have an image showing DiGeorge, or velocardiofacial syndrome, caused by a deletion at 22q11. The green probe is a satellite probe identifying chromosome 22. And the red probe is specific for the commonly deleted region. 
The normal image on the left shows two red signals for the 22q11 region. And the image on the right shows a single red signal for the 22q11 probe, indicating the presence of a deletion. And this one on the right can be seen in both the interphase and the metaphase nucleus. 
But one of the main uses for FISH is in the confirmation of array CGH finding. And this shows a 1q21 deletion, which has been picked up on array CGH. And that's shown on the left-hand side of this slide, where you have the ideogram, and then next to it a graph with a peak representing the 1q21 deletion. So to replicate the finding, a suitable FISH probe has been chosen. And the FISH image here on the right shows a single red signal representing the 1q21 region and therefore confirming the result. 
FISH can also be used in the identification of marker chromosomes. The karyotype here shows an extra piece of chromosome material, labelled here as mar, standing for marker. And the suspicion looking at the karyotype was that the marker came from chromosome 2. So FISH was used to confirm this.
The image on the left shows whole chromosome painting revealing that the marker chromosome is derived from chromosome 2, and that's painted red. And the right-hand image shows a green alpha satellite probe for chromosome 2, again confirming its origin.

Skip to 6 minutes and 7 seconds
FISH is now widely used in hemato-oncology. And that's to aid diagnosis, estimate prognosis, and guide appropriate drug therapy. And the image shows the use of FISH in the diagnosis of chronic myeloid leukaemia, or CML. Probes to BCR and ABL regions are used. And this shows the classic translocation between chromosomes 9 and 22. And this is known as the Philadelphia chromosome, which is pathognomic of CML. 
The arrows point to the translocated chromosome, where the red and green signals can be seen to bind side by side. So having thought a little bit about how FISH works and then the clinical applications of FISH.

limitations of FISH

Let's think, If the “standard” FISH probe is between 100 and 200 kb, what do you think the limitations of FISH might be? One of the key limitations of FISH is that it might not detect deletions that are smaller in size than the FISH probe used. This is because the probe can “bridge” the deletion.
What other disadvantages, not related to size are there of using FISH?
As well as the limitations relating to size, there are also other disadvantages associated with using FISH:
 • The technique is time-consuming and relatively expensive.
• It requires a fresh blood sample (in a lithium heparin tube); the analysis can’t be undertaken on stored DNA.
• The technique is not useful to detect small tandem duplications where the signals will be overlapping and not therefore distinguishable from each other.
What information might FISH give you that is not available from other techniques to look for dosage abnormalities such as array CGH and MLPA? 
FISH will give you positional as well as dosage information. MLPA and array CGH will only tell you about the dosage of a given chromosome locus. 
Source:-

Saturday, 20 June 2020

Complexities of array CGH

Complexities associating with using array CGH.
These include:
  • Accuracy of breakpoint coordinates
The reported array CGH breakpoint coordinates do not reflect the precise boundaries of deletions/duplications. Rather they represent the genomic coordinates of the first and last probe within the region of imbalance.
Some laboratories also report the first and last normal probes. In reality the breakpoints will fall between the last normal/first abnormal probe and the last abnormal/first normal probe.
So find out what your laboratory reports and beware of any genes that seem to lie adjacent to ‘breakpoints’. If you think they could be of relevance to the phenotype then be sure to check back with the lab as to whether they could be disrupted, given the information available.
  • Apparent differences between deletions/duplications in the same family
Sometimes family members are reported as having similar, but not identical, deletions or duplications. In this case, check back with the lab.
It is most likely that they are in fact identical but that a slightly different platform has been used (including different software and different algorithms), or there is inconsistency in the way that the breakpoints have been called (as an artefact of the inherent noise of the calls).
  • Genomic Build
The human reference genome is regularly updated, and a new ‘build’ (or version) brought out. At the time of writing, we are on the 38th build!
The breakpoint coordinates given by the lab will relate to a particular build, which should be referenced on the report.
If as a clinician you wish to enter the coordinates into a genome browser to see for yourself the extent of a deletion/duplication, make sure you use the same build as quoted on the report, or you could end up focused on the wrong genomic region.
  • Partial duplications which may have a haploinsufficiency effect
Beware of any duplication, however small, that may contain a partial gene duplication.
A partial gene duplication inserted in tandem may cause functional disruption of the gene, with a resulting haploinsufficiency effect.
  • Chromosome location of duplications - if not in tandem what are they interrupting?
Array CGH is a quantitative method that will tell you that there is a duplication, but not where it is inserted. Whilst a partial gene duplication in tandem may cause functional disruption of that particular gene, a duplication inserted elsewhere may interrupt and disrupt a completely different gene elsewhere in the genome.
If the phenotype doesn’t fit, or appears more severe than you expect, you would be wise to investigate further.
Source:-https://www.futurelearn.com/courses/molecular-techniques/6/steps/765706


Array CGH methods and applications

Array comparative genomic hybridization (Array CGH) is a method for identifying gains or losses in the chromosomal material by the comparison of patient DNA with a reference DNA.

An array is a glass slide onto which thousands of oligonucleotide probes are spotted. The oligonucleotides represent sections of DNA and are distributed throughout the genome with some areas (ie where there are important genes) having more densely packed probes to ensure better coverage in these areas.
Diagram showing Array CGH process step by step Array CGH process
© St George’s, University of London
The two DNAs are mixed together and hybridised to the array slide containing the thousands of oligonucleotide probes spaced across the genome. Computer software uses quality control checks to ensure optimal results.
The software identifies the genomic region of gain or loss and the genes present within this region. For instance, where there is too much of the patient DNA (ie there is a duplication) and the patient DNA is labelled red, the resultant “spot” will look more red and where there is a deletion there will be over-representation of the green-labelled reference genome and the spot will look more green.
The user can then undertake further analysis of the clinical significance of this finding.

Clinical Applications of Array CGH

Array CGH is used for genome-wide, high-resolution screening of genomic copy number variation (deletions and duplications).
Diagnostic laboratories have increasingly been using array CGH as the first line investigation for patients with intellectual disability, developmental delay, autism and congenital abnormalities. It is also being applied in the prenatal setting following the detection of ultrasound scanning abnormalities in the pregnancy.
Array CGH has largely superseded the previous technique of examining the chromosomes down a microscope (karyotyping). This is primarily because it interrogates the chromosomes at higher resolution, detecting loss (deletions) or gain (duplications) of all or part of a chromosome down to less than 100kb.
Array CGH is more sensitive than karyotyping, detecting an additional 10-15% of clinically significant abnormalities. However, array CGH cannot detect chromosome rearrangements such as balanced translocations, which still require karyotyping, and is unable to identify DNA sequence changes of an individual gene.
It may detect mosaicism, but will not reliably do so, especially if it is present at a low level.

Rare Diseaes Some examples of rare diseases are  Spinal Muscular Atrophy ,   Osteogenesis imperfecta ,   Achondroplasia   or   Rett Syndrome...